


Resource Scheduling and Profiling with Nipype
The latest version of Nipype supports system resource scheduling and profiling. These features allows users to ensure high throughput of their data processing while also controlling the amount of computing resources a given workflow will use.
Specifying Resources in the Node Interface
Each Node instance interface has two parameters that specify its expected
thread and memory usage: num_threads and estimated_memory_gb. If a
particular node is expected to use 8 threads and 2 GB of memory:
import nipype.pipeline.engine as pe
node = pe.Node()
node.interface.num_threads = 8
node.interface.estimated_memory_gb = 2
If the resource parameters are never set, they default to being 1 thread and 1 GB of RAM.
Resource Scheduler
The MultiProc workflow plugin schedules node execution based on the
resources used by the current running nodes and the total resources available to
the workflow. The plugin utilizes the plugin arguments n_procs and
memory_gb to set the maximum resources a workflow can utilize. To limit a
workflow to using 8 cores and 10 GB of RAM:
args_dict = {'n_procs' : 8, 'memory_gb' : 10}
workflow.run(plugin='MultiProc', plugin_args=args_dict)
If these values are not specifically set then the plugin will assume it can
use all of the processors and memory on the system. For example, if the machine
has 16 cores and 12 GB of RAM, the workflow will internally assume those values
for n_procs and memory_gb, respectively.
The plugin will then queue eligible nodes for execution based on their expected
usage via the num_threads and estimated_memory_gb interface parameters.
If the plugin sees that only 3 of its 8 processors and 4 GB of its 10 GB of RAM
are being used by running nodes, it will attempt to execute the next available
node as long as its num_threads <= 5 and estimated_memory_gb <= 6. If
this is not the case, it will continue to check every available node in the
queue until it sees a node that meets these conditions, or it waits for an
executing node to finish to earn back the necessary resources. The priority of
the queue is highest for nodes with the most estimated_memory_gb followed
by nodes with the most expected num_threads.
Runtime Profiler and using the Callback Log
It is not always easy to estimate the amount of resources a particular function or command uses. To help with this, Nipype provides some feedback about the system resources used by every node during workflow execution via the built-in runtime profiler. The runtime profiler is automatically enabled if the psutil Python package is installed and found on the system.
If the package is not found, the workflow will run normally without the runtime profiler.
The runtime profiler records the number of threads and the amount of memory (GB)
used as runtime_threads and runtime_memory_gb in the Node’s
result.runtime attribute. Since the node object is pickled and written to
disk in its working directory, these values are available for analysis after
node or workflow execution by manually parsing the pickle file contents.
Nipype also provides a logging mechanism for saving node runtime statistics to
a JSON-style log file via the log_nodes_cb logger function. This is enabled
by setting the status_callback parameter to point to this function in the
plugin_args when using the MultiProc plugin.
from nipype.utils.profiler import log_nodes_cb
args_dict = {'n_procs' : 8, 'memory_gb' : 10, 'status_callback' : log_nodes_cb}
To set the filepath for the callback log the 'callback' logger must be
configured.
# Set path to log file
import logging
callback_log_path = '/home/user/run_stats.log'
logger = logging.getLogger('callback')
logger.setLevel(logging.DEBUG)
handler = logging.FileHandler(callback_log_path)
logger.addHandler(handler)
Finally, the workflow can be run.
workflow.run(plugin='MultiProc', plugin_args=args_dict)
After the workflow finishes executing, the log file at “/home/user/run_stats.log” can be parsed for the runtime statistics. Here is an example of what the contents would look like:
{"name":"resample_node","id":"resample_node",
 "start":"2016-03-11 21:43:41.682258",
 "estimated_memory_gb":2,"num_threads":1}
{"name":"resample_node","id":"resample_node",
"finish":"2016-03-11 21:44:28.357519",
"estimated_memory_gb":"2","num_threads":"1",
"runtime_threads":"3","runtime_memory_gb":"1.118469238281"}
Here it can be seen that the number of threads was underestimated while the
amount of memory needed was overestimated. The next time this workflow is run
the user can change the node interface num_threads and
estimated_memory_gb parameters to reflect this for a higher pipeline
throughput. Note, sometimes the “runtime_threads” value is higher than expected,
particularly for multi-threaded applications. Tools can implement
multi-threading in different ways under-the-hood; the profiler merely traverses
the process tree to return all running threads associated with that process,
some of which may include active thread-monitoring daemons or transient
processes.
Visualizing Pipeline Resources
Nipype provides the ability to visualize the workflow execution based on the runtimes and system resources each node takes. It does this using the log file generated from the callback logger after workflow execution - as shown above. The pandas Python package is required to use this feature.
from nipype.utils.profiler import log_nodes_cb
args_dict = {'n_procs' : 8, 'memory_gb' : 10, 'status_callback' : log_nodes_cb}
workflow.run(plugin='MultiProc', plugin_args=args_dict)

# ...workflow finishes and writes callback log to '/home/user/run_stats.log'

from nipype.utils.draw_gantt_chart import generate_gantt_chart
generate_gantt_chart('/home/user/run_stats.log', cores=8)
# ...creates gantt chart in '/home/user/run_stats.log.html'
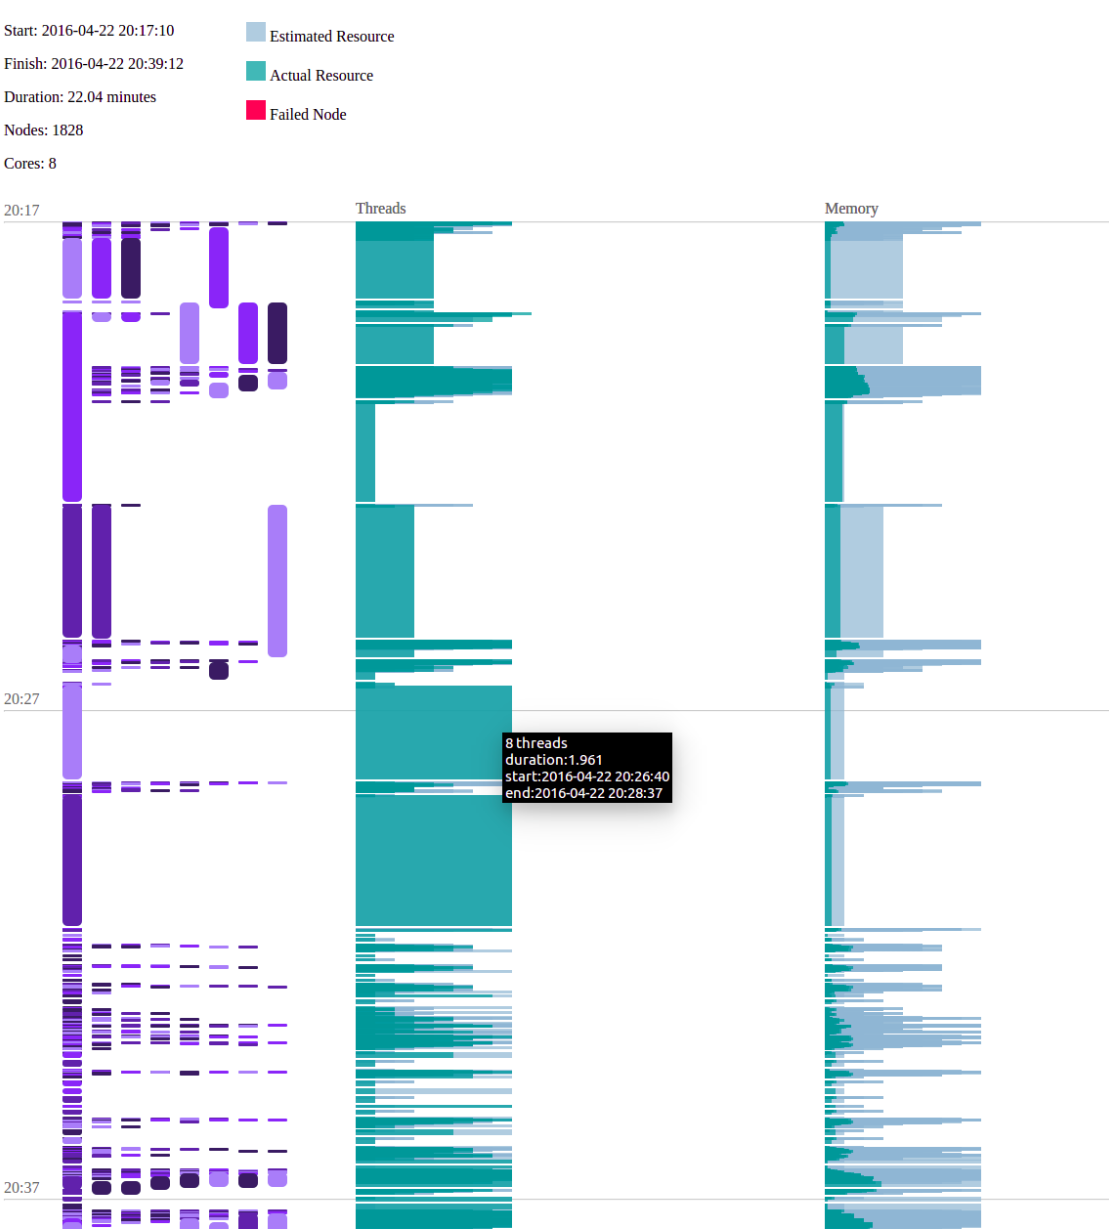
The generate_gantt_chart function will create an html file that can be viewed
in a browser. Below is an example of the gantt chart displayed in a web browser.
Note that when the cursor is hovered over any particular node bubble or resource
bubble, some additional information is shown in a pop-up.